
Not everyone is able to write funky fused operators to make ML models run faster on GPUs using clever quantisation tricks. However lots of developers work with algorithms that feel like they should be able to leverage the thousands of cores in a GPU to run faster than using the dozens of cores on a server CPU. To see what is possible and what is involved, I revisited the first problem I ever considered trying to accelerate with a GPU. What is unusual about my chosen problem is that it is officially pointless, so you ought not to be able to find any library that will accelerate this algorithm, because it isn’t worth writing one! That makes it an interesting proxy for algorithms which aren’t catered for by high-performance libraries written by experts, but can be structured to run thousands of threads in parallel.
TL;DR
Getting an existing C++ algorithm running on GPU is pretty easy, so it is a low bar to get started. What I learned is the importance of minimizing thread divergence and maximizing effective memory access speed. To do that effectively, I had to transform my algorithm into a state machine structure so that every thread is operating mostly in lock-step, just with different data values.
My starting, interim and final code are open to see, along with a summary of the steps I took, and the corresponding improvements or regressions at each stage. I want to focus in this article on the thought process for deciding each step, mostly by explaining the Nvidia Nsight Compute analysis which helped guide me.
In the end I managed to make my program run about 30x faster on my laptop using its GeForce GTX 1650 GPU, compared with its Core i7–9750H CPU. Only in the last two steps did it get meaningfully better than with CPU though, so be prepared for early and frequent disappointment.
If you want just the summary of what worked, jump to Progression History.
A Pointless Program
Years ago, a colleague invited me to take on his Christmas programming challenge, which was to write the fastest program he could to continuously play the card game Beggar My Neighbour. The aim, noted by John Conway as definitely not worth solving, is to try to find the longest game — with the possibility that there might be a game which never ends. The longest game found so far has 8344 turns — a rainy afternoon diversion perhaps, if you can sustain playing a card every 2.589 seconds for six hours straight! You can see a history of new records, with a Python program that verifies them, here: https://github.com/matthewmayer/beggarmypython
The game play algorithm is almost trivial, but it has some notable features which turn out to be relevant to the challenge of effectively leveraging a GPU.
Game play is completely deterministic, so the outcome is defined only by the initial sorting of the deck. The problem is therefore embarrassingly parallel, since there are 653,534,134,886,878,245,000 (roughly ) distinct deals, and we can play as many as we want in parallel, in any order.
The algorithm tracks game state by using a few state variables and nested branching logic. This is easy to write and verify, and actually reasonably efficient to run on a single CPU core.
The algorithm is very compact in terms of code size and data size. The search loop to play many games while tracking the best ones so far is also very compact.
CPU Starting Point
My initial C++ program to search for long games is here. It is just a port of the Python program with a search loop that runs continuously, shuffling the deck randomly between games. I implemented two simple optimizations that seemed obvious:
a 64-entry circular buffer for each player’s hand and the discard pile, combined with a bit mask step to dereference the first and last index pointers. This avoids extra instructions and branches to handle wrap-around of the first and last index values as cards are added and removed.
swap two cards between each game, to use fewer random numbers — we don’t need each deal to be completely random, but just have a random difference from the previous one.
The program can use multiple CPU cores by just running separate copies of the search loop in different threads, starting with different RNG seeds. Each search loop does its own random walk through potential deals.
On my laptop, throughput peaks at 2.9 million deals per second, using 12 threads to match the number of logical CPU cores.
Initial GPU Port
The beauty of General Purpose GPU programming is that you can often get started quickly with the code you already have. There is a good chance that only a few adaptations are needed to convert a program that uses multiple threads on CPU to one that runs with even more threads on GPU, as long as you don’t have extreme memory requirements (for code or data or both) which force breaking up the work into smaller pieces.
GPU cores have a similar range of machine instructions to those of CPUs, so plain algorithms will compile readily enough to give reasonable single core efficiency; you don’t need to transform your program to use a subset of variable types or data structures or code constructs, or special parallelization primitives or libraries. You mainly just need to cope with some changes to library functions (such as the random number generator in my case), and finessing of class structures to graft in the global functions needed to launch work on the GPU.
You do need to be ready for disappointment though.
If your code is similar to mine, founded on nested branching logic, you may find that the GPU won’t even be able to match the CPU performance at first. This is to be expected: CPUs are designed for running unrelated complex branching logic in each thread, dedicating significant chip area on circuitry to predict branches, speculatively execute multiple paths, and do lots of caching — 1 MB per logical CPU core in my laptop for instance. CPU cores also run fast, with 3–4GHz max speed being fairly typical. By comparison, GPUs are much lighter on hardware per core for caching, branch prediction etc, and top out at perhaps 1.5–2GHz (unless you have an extreme cooling gaming GPU). They come with faster memory though, to help compensate.
But the net effect is that an algorithm will probably run 2–3 times faster on a single CPU core than it will on a single GPU core, from a combination of the clock speed ratio and more aggressive single thread acceleration. You need to figure out how to make good use of the thousands of slow GPU cores in order to outperform a few fast CPU cores.
My initial port to GPU ran at about 1.4M deals per second (once thermal throttling kicks in), using 2048 threads (128 blocks of 16 threads each). Not an encouraging start, but in hindsight about what I should have expected.
Learn to use Nsight Compute
Early on, I decided to get comfortable using the Nsight Compute tool to analyse the GPU portion of
my code in spectacular detail, rather than trying to rely on intuition and the high-level
utilization figures from nvidia-smi. The approach I settled on was to step through the execution of
the first couple of GPU kernel launches (the kernel here being my global function which runs the
core search and game play loop for a predefined number of iterations), and then profile the next
kernel run to see how much of the hardware capability was being used effectively.
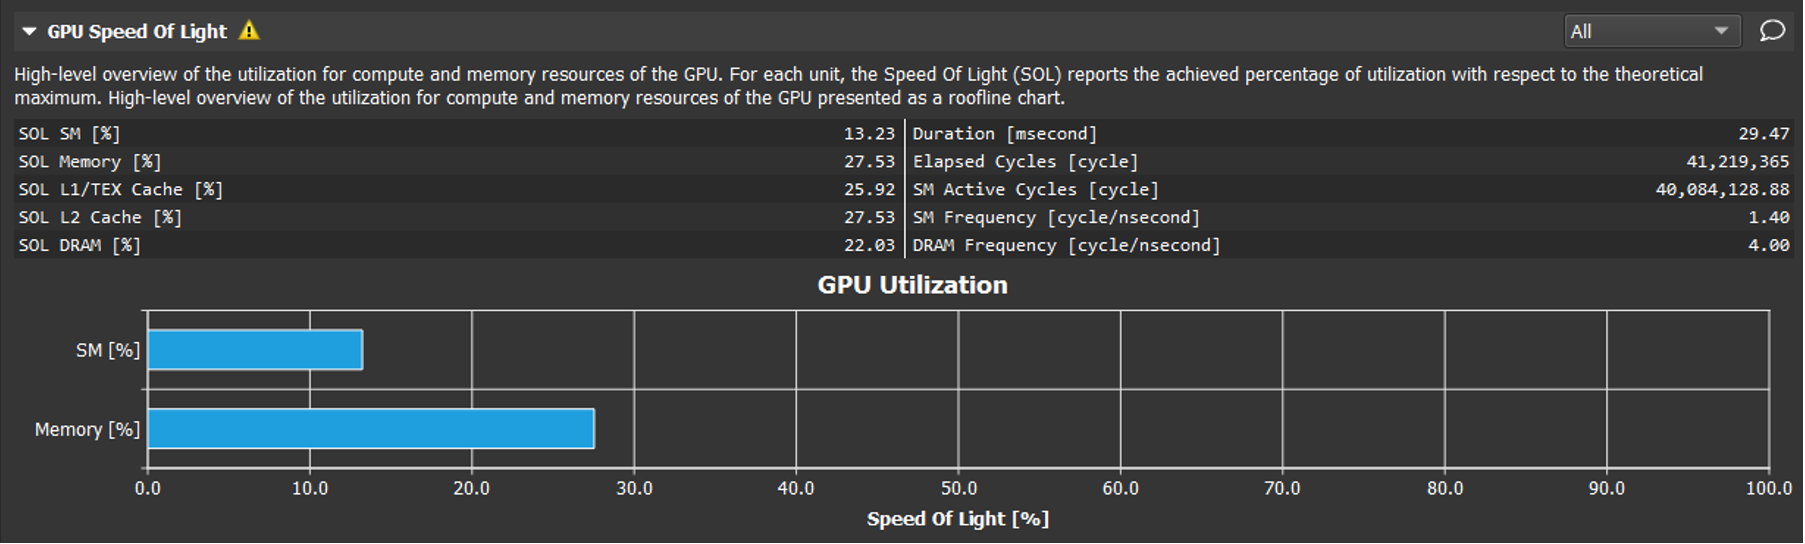
The first, unflattering, report that the tool shows is the “Speed of Light” summary: ie. the
percentage of theoretical peak performance on compute and memory bandwidth utilization. My first
program scored around 12% for compute, and 28% for memory. (For the same program, nvidia-smi would
report 88% and 28% utilization respectively, underscoring how misleading its information can be when
you are trying to optimize your algorithm in the early stages.)
There were many detailed metrics underneath the headline figures which could be examined, and various analysis warnings that point out potential problem areas. Many of these sounded esoteric, but there were two reasonably clear actionable warnings:

The first one was easy to address: assign at least 32 threads per block (not 16), so we don’t leave
warp capacity unused for not even trying. I ended up settling on 32 blocks of 32 threads, which
increased throughput to 2.3M deals per second. nvidia-smi now reported 95% and 13% for compute
and memory utilization. Nsight Compute reports we have improved average active threads per warp from
2.4 to 3.6. That left Thread Divergence as the key warning to address.
Thread Divergence
If you have learned about CUDA programming before, you may recall that thread divergence occurs when not all threads in the same warp are executing the same instruction. (Each group of 32 consecutive threads in a block will always execute together as a unit, known as a warp, and GPU hardware is heavily optimized around running these warps of threads very efficiently on the assumption that the threads are normally executing instructions in unison, working on closely related pieces of the same computation.)
It is part of the beauty of General Purpose GPU programming that thread divergence is allowed, and is handled automatically by the hardware as well as it can be, by simply letting the threads in the warp take turns to run their next instruction, when they are different. Subsets of the warp that do share the next instruction will execute together, so degradation in performance is proportional to how much the threads have diverged from each other.
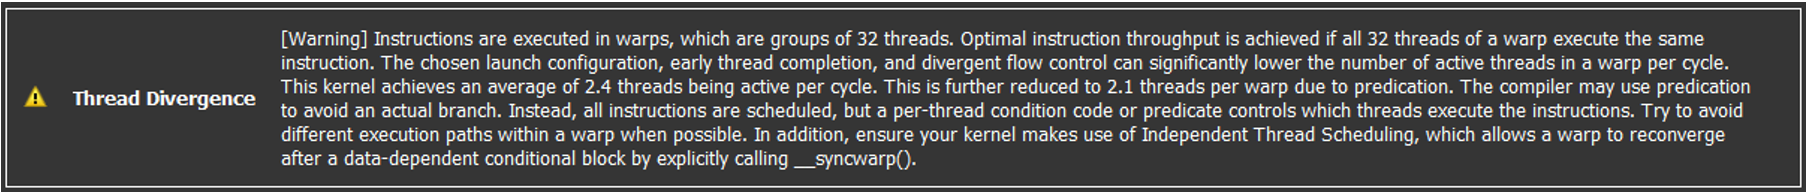
In the worst case, where every thread is at its own unique point in the code, the threads are effectively time sliced on the hardware, and so running at 1/32 of the hardware’s potential. From the Nsight Compute warning, I could see we were quite close to that point:
[Warning] Instructions are executed in warps, which are groups of 32 threads. Optimal instruction throughput is achieved if all 32 threads of a warp execute the same instruction. The chosen launch configuration, early thread completion, and divergent flow control can significantly lower the number of active threads in a warp per cycle. This kernel achieves an average of 3.6 threads being active per cycle. This is further reduced to 3.1 threads per warp due to predication. The compiler may use predication to avoid an actual branch. Instead, all instructions are scheduled, but a per-thread condition code or predicate controls which threads execute the instructions. Try to avoid different execution paths within a warp when possible. In addition, ensure your kernel makes use of Independent Thread Scheduling, which allows a warp to reconverge after a data-dependent conditional block by explicitly calling
__syncwarp().
Getting about 3 active threads per warp means I’m only tapping into about 1/10th of the GPU’s
compute capacity, at best. Not exactly what you would assume from the 95% compute utilization figure
reported by nvidia-smi — that figure really just means I’m doing something on all of the GPU’s
Streaming Multiprocessor or SM units about 95% of the time — even if that something is very
inefficient at using each SM, as in this case.
I highlighted the most relevant part of the remediation advice above, which is essentially to remove the nested branching logic as much as I can. To do that in my program, where each thread is working on a different game, I realised I would have to rewrite the core game play function. The original version uses position within the code’s nested branching structure to encode part of the game state — I needed to replace that with an explicit data representation of all pieces of game state. Then every step of the inner loop would be executed in unison across all threads playing their own games, just with different data values.
Rewrite to use a lookup table
To make the inner loop purely data driven, I chose to introduce a state transition table. Game state is now tracked explicitly in variables which are treated as inputs to the transition lookup table, followed by a set of actions that is always performed on every iteration using data values from the lookup table.
A critical realization for implementing this cleanly in my case was to notice that the discard pile can be treated as a third player in the game, with some extra states to track when the discard pile is “playing” its cards to the player who won the last trick. With that mental twist in place, a fairly straightforward lookup table became possible to write by hand. The code for this version is here; it works on both CPU and GPU, but it is slower on both — about half the speed of the baseline version on CPU, and two-thirds on GPU. ☹
Being slower on CPU was expected, since it requires more instructions to manipulate more state variables, and there is more memory access to lookup state transitions. We also have forced the adding of the discard pile to the winning player’s hand on every trick to be done slowly, as individual turns with all the overhead needed for that. However, on GPU I had hoped to see gains because now more threads in each warp should be able to execute in unison.
In fact Speed-of-Light compute and memory utilization figures did improve, to 17% and 38% respectively, but Thread Divergence was still listed as a remediation warning. We are at least up from an average of 3.6 active threads per warp to 5.3, but that is small comfort given the actual speed is now about back to where I first started on GPU, which is well behind the CPU performance.
Ah, be careful about function exits
What I had forgotten is that thread divergence will also occur when threads are exiting from a
nested function inside the kernel. My game play loop would always play one game (inside the function
play), then return to the search loop to swap two cards before calling play again. It basically
didn’t matter that inside the play inner loop thread divergence has been largely solved, because
each thread in a warp will still finish at different times, depending on how many turns are needed
for their respective games. So they usually diverge at game end, and the whole warp of threads must
wait for the longest game amongst them to finish. Stats on the range of game lengths shows a minimum
of about 33 turns, an average of about 250 turns, and a max somewhere in the many thousands of turns
at least. That’s a lot of variation.
With that realization, my next program refactoring was to include the logic for game completion
book-keeping and switching to a new game as another (necessarily conditional) step in the inner game
playing loop. This slows down the inner loop even further, but allows the threads to stay mostly
converged across multiple games. To support this, I pre-create a backlog of games to play, ready for
the next game to be picked very quickly from inside the inner loop by whichever thread is available
first. (This introduces the only inter-thread synchronization mechanism needed so far, which is the
use of a CUDA atomic operation to read and increment the next_deal_to_play index, which barely
affects speed but solves the race condition.)
In order to allow the threads to run as long as possible in this synchronized inner loop, I decided to use a big chunk of main GPU memory to hold a large backlog, which so far has barely been used (just for the search loop’s best-game-so-far records).
We now get to a near-final version of the program, which can be recreated from the latest version using some conditional compilation definitions. This version fills a large (eg. 1M entry) backlog of deals to play in GPU memory (using another kernel of cooperating GPU threads working in parallel), which is then processed in parallel by 1024 threads (32 blocks of 32 threads). Performance did indeed improve over the initial version with the lookup table, but only to about the same speed as the baseline version, which was achieved once I had tweaked the number of blocks and threads. What gives?!
Ah, memory speed really matters
Nsight Compute reveals Speed-of-Light is about the same as before (12% compute and 37% memory utilization), and again lists a number of warnings. This time, some other warnings now seem more relevant and actionable (as I’ve highlighted below):
- High Pipe Utilization
[Warning] All pipelines are under-utilized. Either this kernel is very small or it doesn’t issue enough warps per scheduler. Check the Launch Statistics and Scheduler Statistics sections for further details.
- Issue Slot Utilization
[Warning] Every scheduler is capable of issuing one instruction per cycle, but for this kernel each scheduler only issues an instruction every 6.0 cycles. This might leave hardware resources underutilized and may lead to less optimal performance. Out of the maximum of 8 warps per scheduler, this kernel allocates an average of 1.00 active warps per scheduler, but only an average of 0.17 warps were eligible per cycle. Eligible warps are the subset of active warps that are ready to issue their next instruction. Every cycle with no eligible warp results in no instruction being issued and the issue slot remains unused. To increase the number of eligible warps either increase the number of active warps or reduce the time the active warps are stalled.
- CPI Stall ‘Long Scoreboard’
[Warning] On average each warp of this kernel spends 2.4 cycles being stalled waiting for a scoreboard dependency on a L1TEX (local, global, surface, texture) operation. This represents about 39.7% of the total average of 6.0 cycles between issuing two instructions. To reduce the number of cycles waiting on L1TEX data accesses verify the memory access patterns are optimal for the target architecture, attempt to increase cache hit rates by increasing data locality or by changing the cache configuration, and consider moving frequently used data to shared memory.
Thread Divergence is still listed as a warning, though the average active threads per warp is now at about 9. Looking at the “source” view of the kernel profile, which shows per-instruction info such as the execution counts, average active threads, distribution of instruction stall reasons etc, it looks like there are lots of times when the inner loop instructions are stalled waiting for access to results from memory.
So it looks like there are two clear problems we can address:
Ensure there are more (warps of) threads available to schedule, so they can hide the micro-latencies that are naturally experienced by any one warp.
Reduce the times when the inner loop is stalled accessing GPU memory.
The first issue can in theory be addressed by playing with the blocks and threads configuration. However, changing that doesn’t really make a difference: we are primarily bottlenecked on accessing data from GPU memory.
Use Shared Memory as much as possible
The best improvement we can make now is ironically to stop using main GPU memory as much as we can. In my case, that means replacing the single large backlog of deals with a very small backlog per block, held in Shared Memory.
As you may recall from CUDA Programming primers, Shared Memory is the fastest memory area (other than registers allocated by the compiler) available to programmers, but the most limited in size. On my laptop’s GPU, it is limited to 48KB — the same amount of memory as my first home computer (from the Apple II era). This memory is per-block and only available while each specific block is executing — its contents will be lost when that block ends, so relevant info needs to be copied to main memory as final output.
Thankfully for my program, using this only involves a modest code change, and basically means the inner game loop runs for fewer iterations before the local backlog is exhausted and has to be replenished. Also each small backlog is shared by fewer threads, so there is more opportunity for some threads to finish early and increase thread divergence.
With this change (which included changing blocks and threads to 16 and 128, in order to try and provide more warps to the scheduler as noted above), performance on GPU finally moved ahead of CPU for the first time, and by a fairly impressive margin, reaching about 40M deals per second (vs. 3M on CPU)!
Nsight Compute is still saying we are memory bottlenecked though. Final chance to squeeze further!
Make Shared Memory stretch as far as possible
My final change is to recognise that the core data structures are using more memory than they need
to, since I’m using an enum to represent 5 possible card values, and enum by default is
represented as an int in C++, which is treated as a 32-bit word in CUDA. Similarly, the lookup
table data values are all defined as int, but far fewer bits would suffice. I had initially
wondered whether native word sized values were more efficient at the individual instruction level,
but actually GPUs (like most CPUs) efficiently support sub-word data sizes and even arbitrary
bitfield operations at the instruction level, so that isn’t an important concern.
With a change to specify uint8 as my enum base type, add appropriate bitfield declarations in the
lookup table struct, and use a more compact representation of deals in the backlog (not the 64 entry
circular buffer representation used for playing fast), I am able to squeeze a longer backlog into
the 48KB of shared memory, and also reduce the memory bandwidth needed for lookup operations and
other game play steps.
The effect is rather gratifying: my final version now hits over 100M deals per second, at least until thermal throttling brings it back down to 95M or so. 😊
Nsight Compute is still saying I’m memory bound, but at this stage I’m thinking that may be just how it is. The algorithm is so light on computation that it will typically be waiting on memory (even the super-fast Shared Memory) no matter what. The next step, if it were possible to see how to restructure the game playing loop in a suitable way, would be to try and ensure we created coalesced memory access patterns (where threads in a warp all reference directly adjacent memory locations that allow the hardware to make them one read/write operation). But that seems very unlikely to be possible with each thread still working on its own deal.
Maybe there is still some potential for improvement from tweaking block and thread counts, and paying attention to memory layout and other micro-details. I’m not holding my breath!
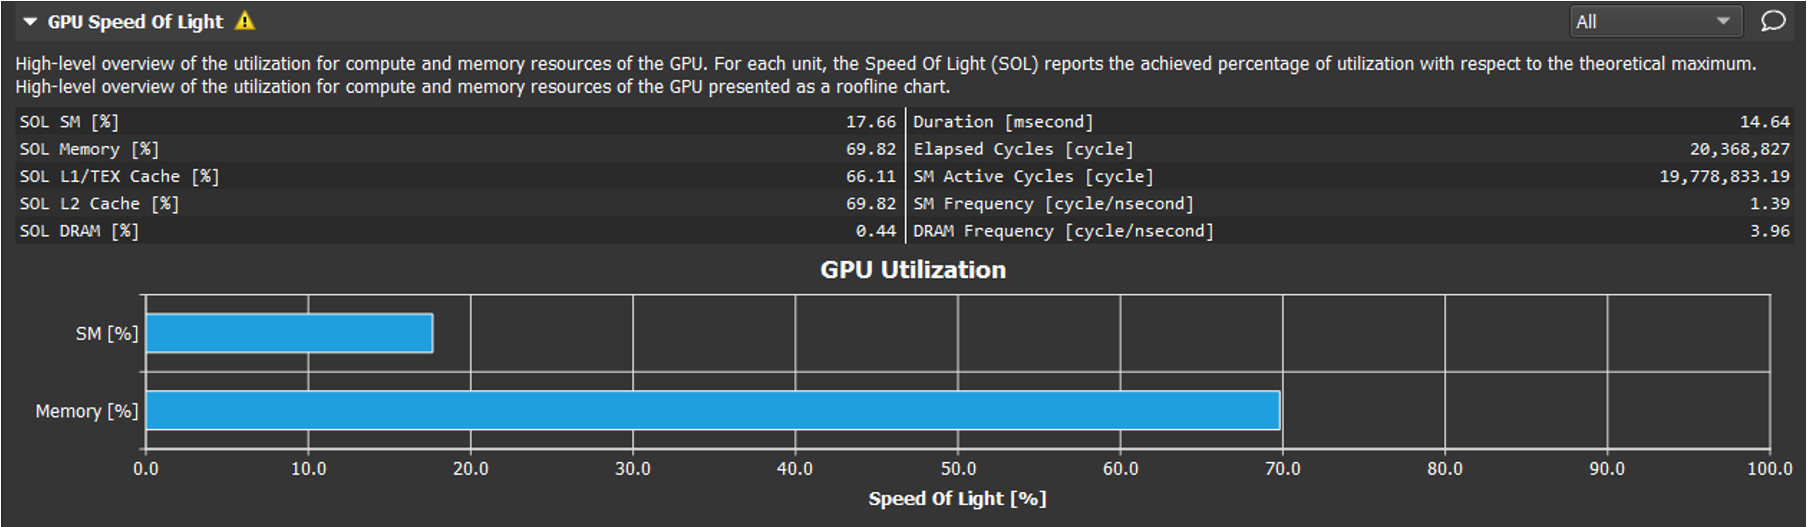
- Final Speed-of-Light score: 18% compute, 70% memory utilization.
nvidia-smireports 90% and 1% for compute and memory utilization respectively.- Thread divergence is reduced, with average active threads per warp of 20 (vs. ideal of 32).
Progression History
From initial CPU version to final decent GPU version, here was the history of changes and results. All performance numbers are in millions of deals per second.
| CPU perf | GPU perf | Changes | Key Nsight Compute recommendations to fix | |
|---|---|---|---|---|
| Starting point | 2.9 | -- | ||
| GPU baseline | 1.4 | Straight port from C++ | Launch Config, Thread Divergence | |
| GPU baseline with config tuning | 2.3 | Use 32 threads per block (not 16) | Thread Divergence | |
| Lookup table for game play | 1.9 | 1.4 | Rewrite inner game loop to use lookup table and fully explicit game state (instead of nested branching logic). | Thread Divergence (Thought I had fixed it, but still happens at end of games.) |
| Include game switch step in inner loop | -- | 2.5 | Generate large backlog of deals in GPU memory, switch to new game inside inner loop without exiting, so threads stay in sync Not enough active warps, Warps are often stalled. Recommend using shared memory | |
| Move backlog to shared memory | -- | 40 | Replace large central backlog in main GPU memory with small per-block backlog in shared memory | Not enough active warps, Warps are often stalled |
| Shrink data structures as much as possible | 3.0 | 100 | Use uint8 enums, bit packed structures, etc. | Not enough active warps, Coalesce memory references if possible |